
Page 26 - April 2024 Newsletter
P. 26
countryside. Of course, the actual amount of water eventually
reaching rivers is dependent on the saturation level of the
ground. Given that last autumn and this winter were so wet, it
is likely the ground was already saturated before the start of
February.
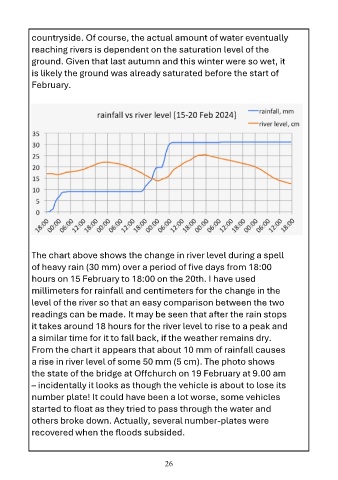
The chart above shows the change in river level during a spell
of heavy rain (30 mm) over a period of five days from 18:00
hours on 15 February to 18:00 on the 20th. I have used
millimeters for rainfall and centimeters for the change in the
level of the river so that an easy comparison between the two
readings can be made. It may be seen that after the rain stops
it takes around 18 hours for the river level to rise to a peak and
a similar time for it to fall back, if the weather remains dry.
From the chart it appears that about 10 mm of rainfall causes
a rise in river level of some 50 mm (5 cm). The photo shows
the state of the bridge at Offchurch on 19 February at 9.00 am
– incidentally it looks as though the vehicle is about to lose its
number plate! It could have been a lot worse, some vehicles
started to float as they tried to pass through the water and
others broke down. Actually, several number-plates were
recovered when the floods subsided.
26